
| E4215 Home | Schedule/Assignments | Handouts | Project(pdf) | Home | Teaching |

Cadence main window
Select Tools->Library manager to bring up the library manager. Selecting Help on any window brings up the help on that topic. Cadence help is comprehensive, but it can be difficult at times to find what you want.
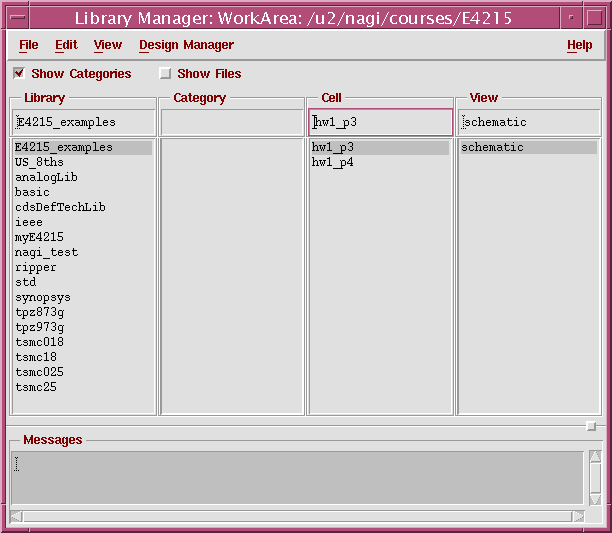
Library manager
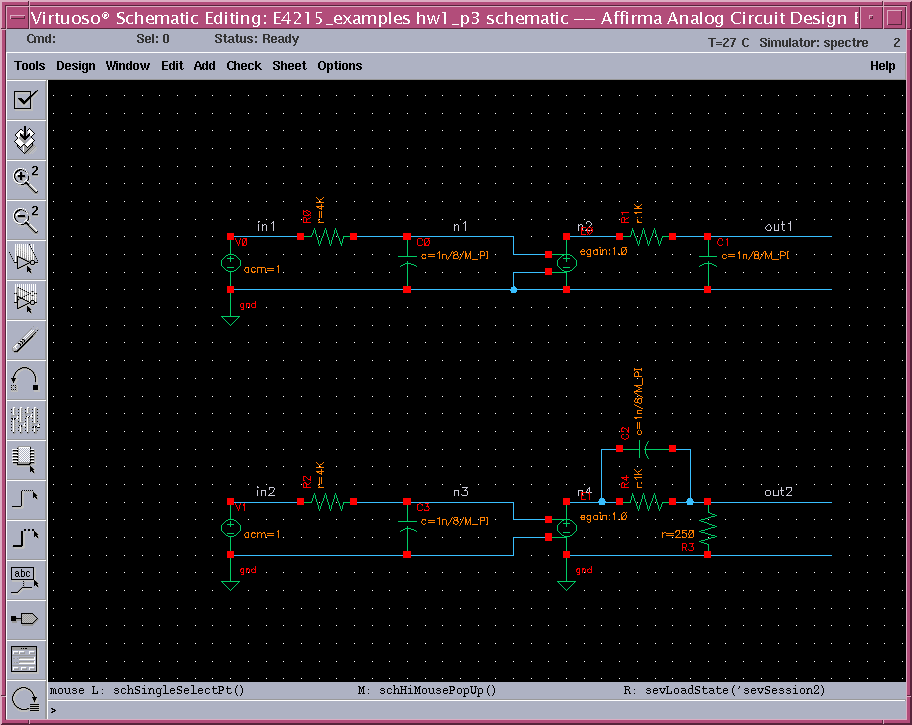
Schematic for HW1, P3
Selecting a component and pressing q brings up a form that shows the component properties. Verify the names and values of each component. M_pi=π=3.1415926... is a spectre constant.
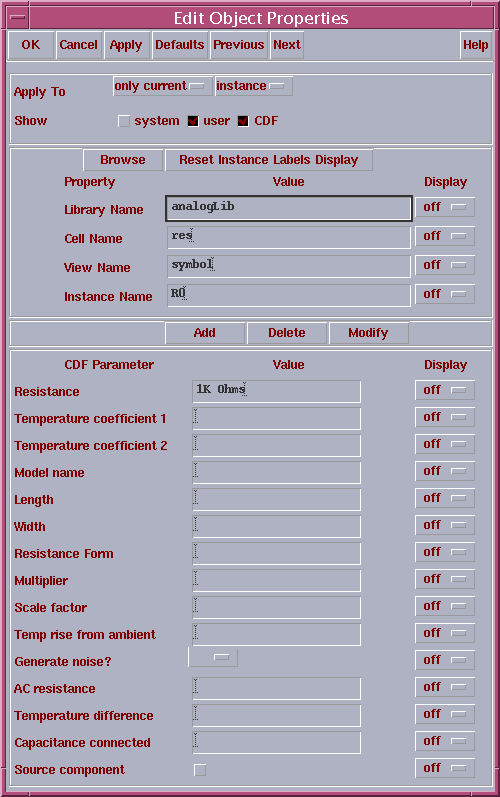
Instance property form
The voltage sources V0 and V1 have a value of 1V at all frequencies. The voltage at any other node(n1, n2, n3, n4) then is 1V times the transfer function of the circuit from the input to that node-i.e. the transfer function itself. Thus the transfer function of circuits can be evaluated.
AC simulation is used to simulate the transfer function of the circuit. All nonlinear components are linearized about their operating points. You cannot simulate nonlinear effects using this.
Bring up the simulation interface by selecting Tools->Analog Environment from the schematic window.
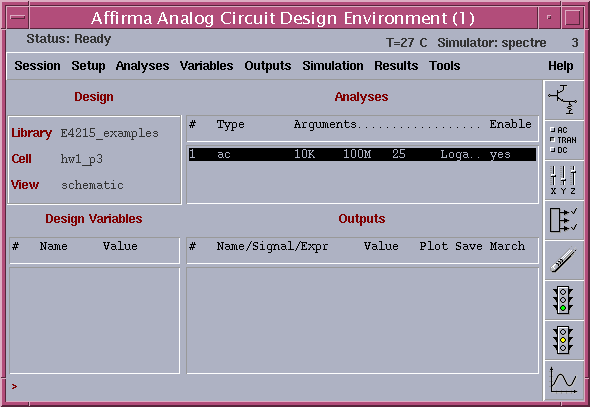
Analog artist window for hw1_p3. The line showing the ac analysis appears after you select the analysis.
From the Analog Circuit design environment window, Select Analysis-> choose to bring up a window with several analyses. Choose ac. Select Frequency for the sweep variable, Logarithmic for the sweep type. Fill in 10k, 100M for the start and Stop frequencies, 10 for the number of points per decade. OK the form.
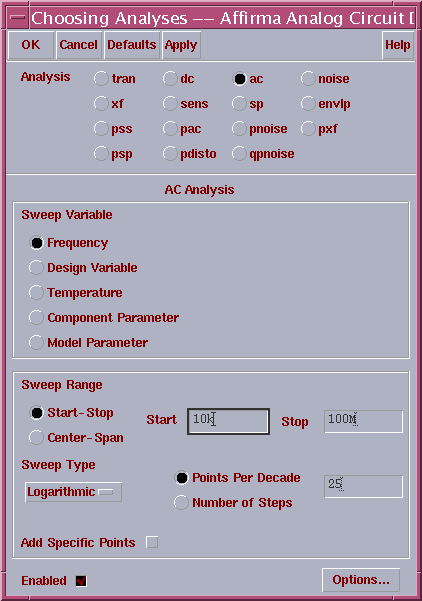
AC analysis window
This does an ac analysis-i.e. evaluates the small signal frequency response of the circuit from 10kHz to 100MHz with 10 logarithmically spaced points every decade(10kHz to 100kHz, 100kHz to 1MHz, etc.).
Select Simulation->Netlist and Run in the analog artist window to start the simulation. A simulation log window pops up, displaying the simulator's actions.
After the simulation finishes, select Results->Direct plot->AC magnitude and phase. Now you can select the nodes in the circuit and display the magnitude and phase at that node, which is the magnitude and the phase of the transfer function from the input to that node. Select out1 and out2 and hit ESC. A waveform window with the curves will be displayed.
Select Subwindows->Add to add new subwindows. The curves can be dragged from one subwindow to the other to get a plot as the one below.
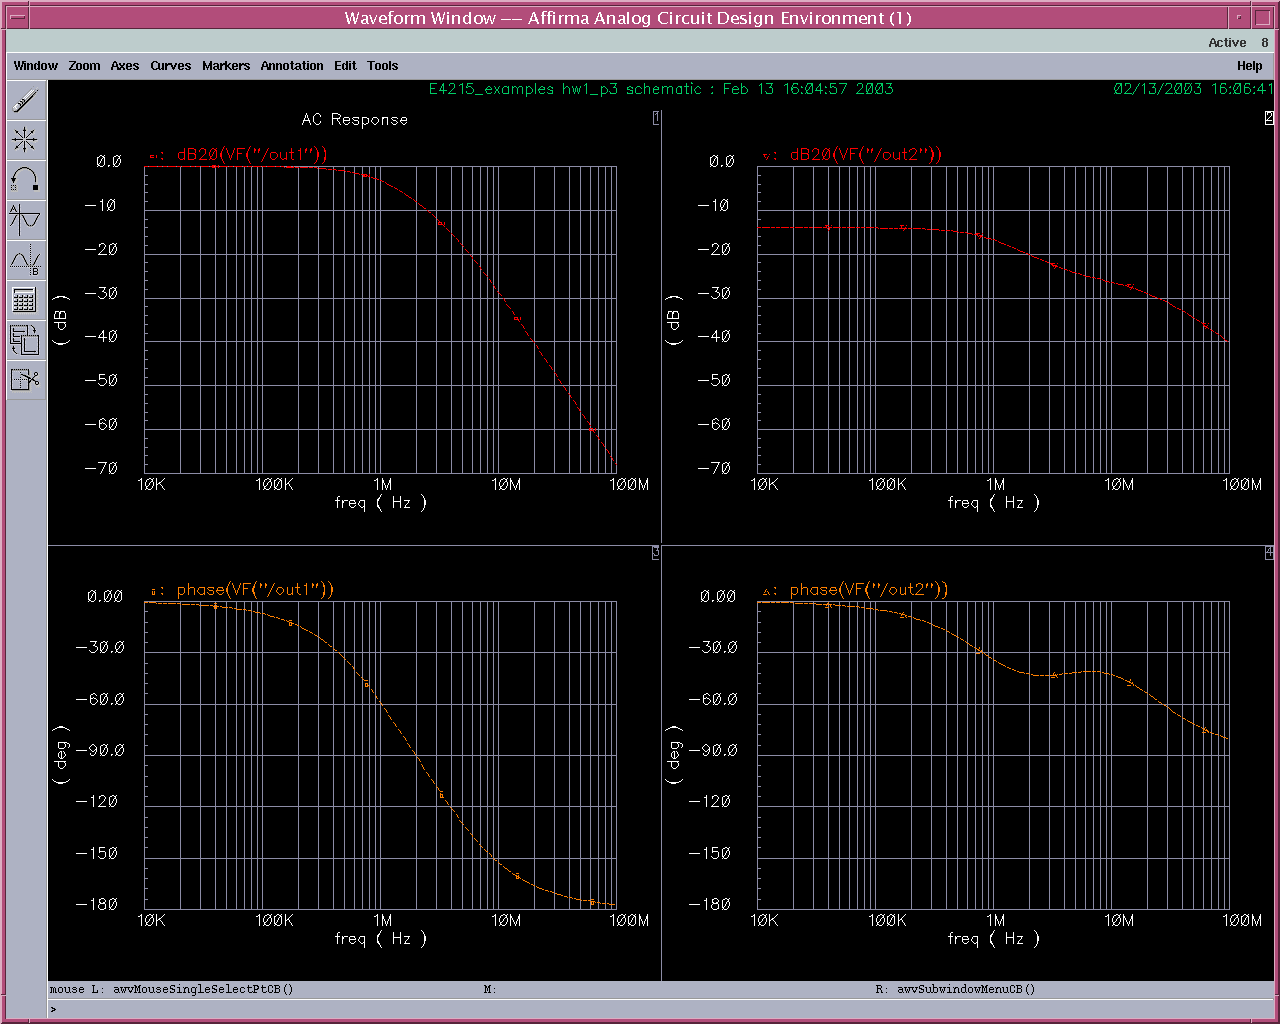
AC analysis results
Compare the answers to your answers to HW1 and the provided solutions.
Try other plotting options: plotting the transfer function to other nodes; plotting magnitude in linear units instead of dB; scaling the axis etc.
Try other simulation options. Change the range of frequencies; number of points; Linear instead of Logarithmic sweep etc; and re simulate.
You can save the state of the analysis by choosing Session->Save state. This can be restored when you want to simulate this circuit the next time.
Close the simulator and the schematic.
From the library manager bring up the schematic hw1_p4. This schematic is set up with a pulse source V1 to determine the response of the circuit to a pulse. Verify the parameters of the pulse source-most of the terms are self explanatory; and other components in the circuit. Verify that the pulse width is indeed equal to R1C1.

Schematic for HW1, P4
Bring up analog artist window as before.
Analog artist window for hw1_p4
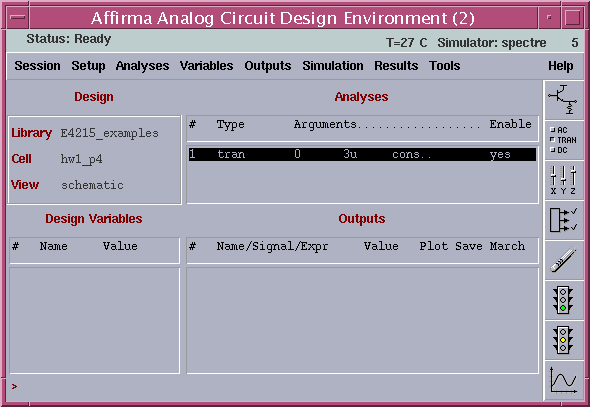
From the Analog Circuit design environment window, Select Analysis-> choose to bring up a window with several analyses. Choose trans. Enter 3u for the stop time and conservative for the error criterion(This determines how "exact" the numerical simulation is) OK the form.
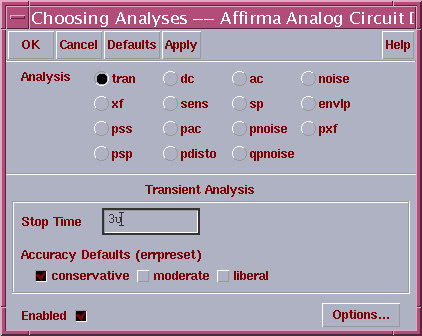
Transient analysis window
You are now set up for running a "transient" analysis for 3 microseconds.
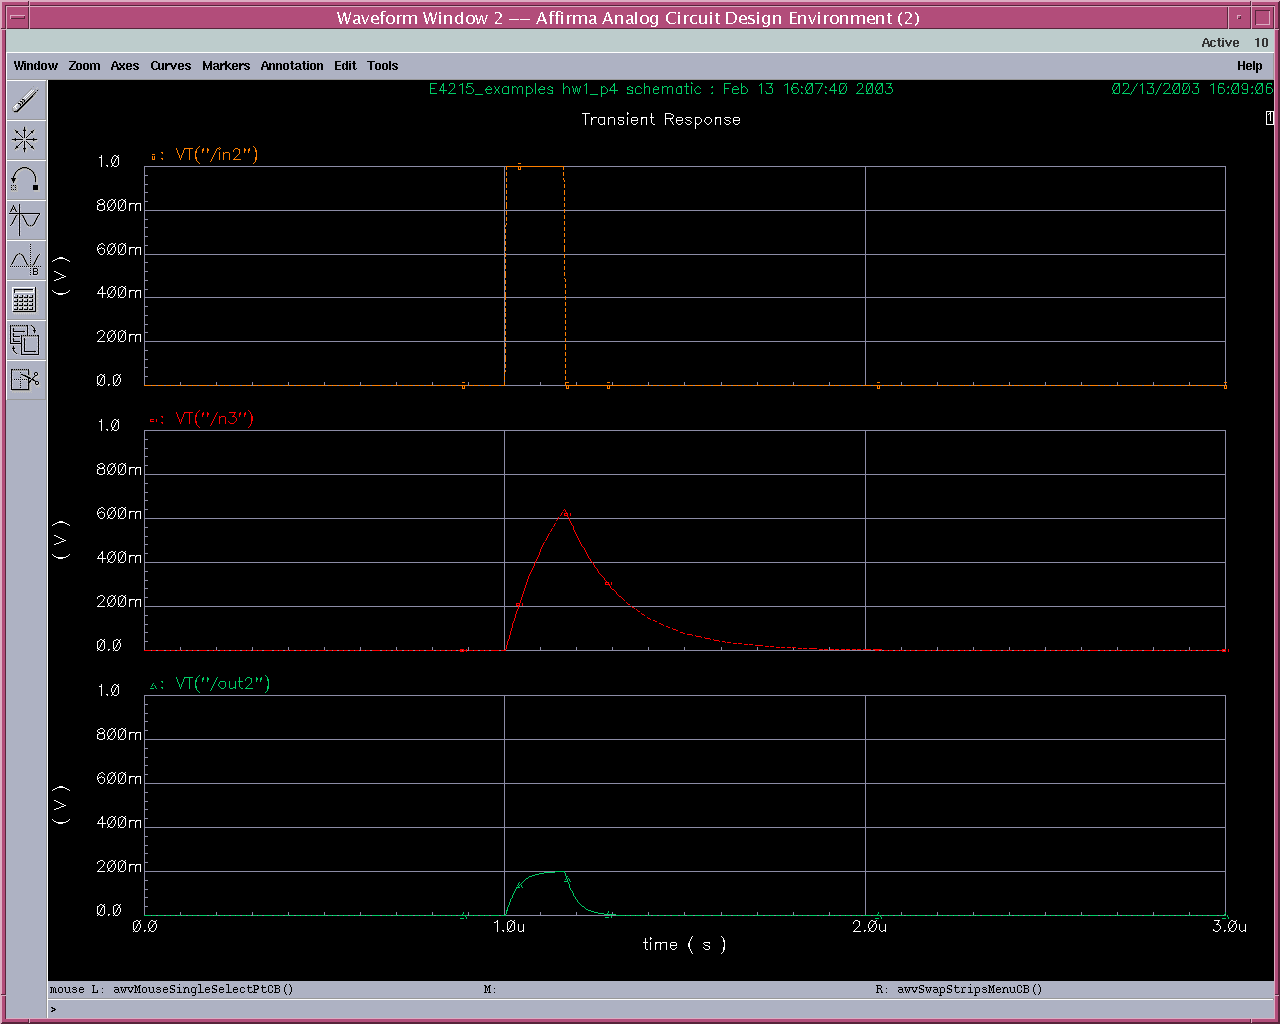
Transient analysis results
Select Simulation->Netlist and Run in the analog artist window to start the simulation. A simulation log window pops up, displaying the simulator's actions.
After the simulation finishes, select Results->Direct plot->Transient. Now you can select the nodes in the circuit with the mouse and display the magnitude and phase at that node, which is the magnitude and the phase of the transfer function from the input to that node. Select in2, n3 and out2 and hit ESC. A waveform window with the curves will be displayed. Select Axes->To strip to separate the curves.
Verify that the input pulse is of the desired width and height. Relate it to the properties of V1 on the schematic(by selecting the component and pressing q). Relate it to the RC time constants in the circuit. Compare the other waveforms to your answers to HW1 and the provided solutions.